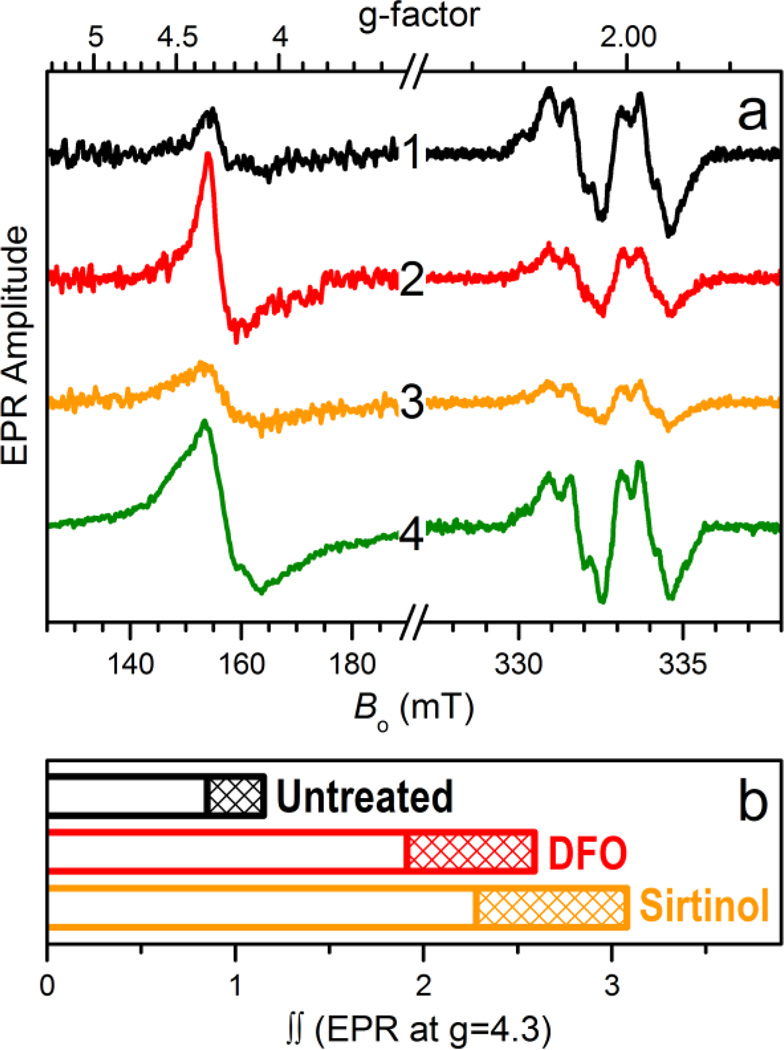
Figure 4.
Panel a, EPR spectra of intact Jurkat cells (g = 4.3 and g = 2 regions). Traces 1 through 4 are obtained, respectively, for the untreated sample and for samples treated (50 µM × 3 h) with DFO (2), sirtinol (3), and complex FeIII(sirtinol−H)(NO3)2 (4). Experimental conditions: microwave frequency, 9.337 GHz; microwave power, 2 mW; magnetic field modulation amplitude, 0.5 mT; temperatures, 10 K for g = 4.3 region and 30 K for g = 2 region. Trace 4 in the g = 4.3 region is scaled down by a factor of 1/3. Panel b, relative double integrals of the g = 4.3 signals shown by traces 1–3 in panel a (the double integral value for the untreated cells is set as 1). The patterned regions correspond to the error of ± 15% typical for such estimates. For comparison, the double integral value for g = 4.3 region of unscaled trace 4 (not shown) is 20 ± 3.

