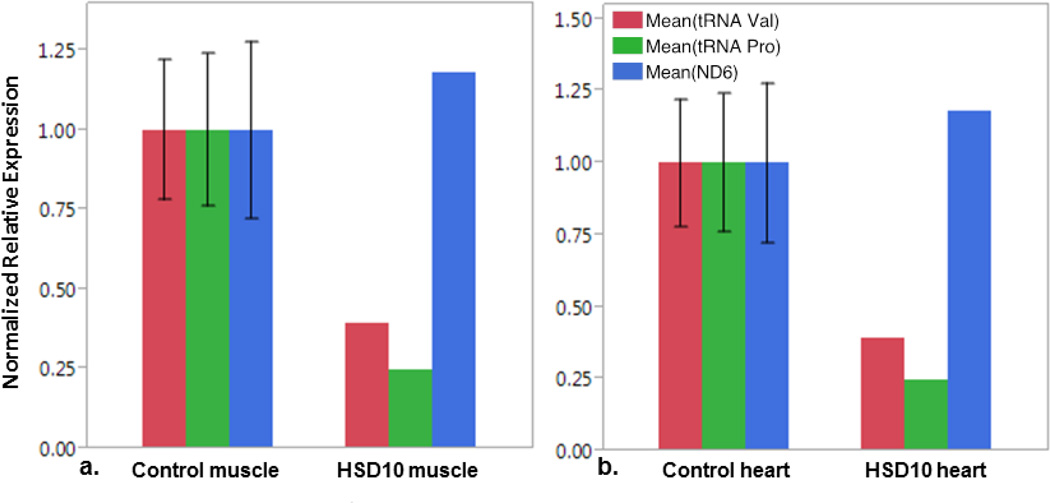
Figure 8. Quantification of total mitochondrial RNA transcripts.
RT-qPCR relative quantification of mitochondrial RNA transcripts tRNA Val, tRNA Pro, and NADH dehydrogenase 6 (ND6) as noted in legend in a.) muscle and b.) heart tissue from control subjects (Ctrl) and from the patient (HSD10). Primers sets anneal within gene exon, and therefor amplify both pre and processed transcripts. No statistically difference between controls and patient tissues.

