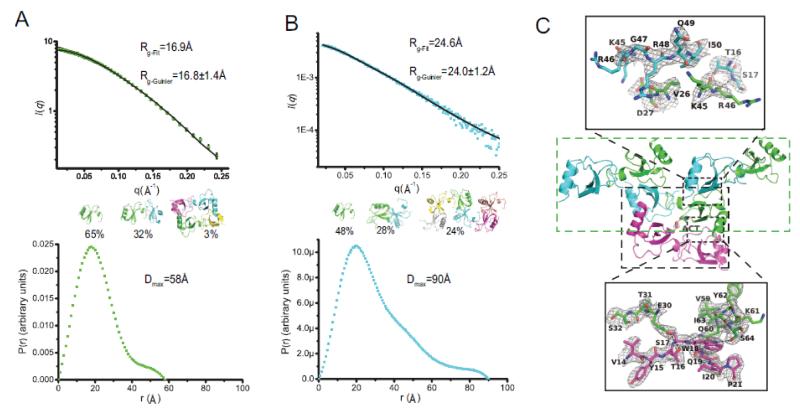
Figure 2. Oligomer structures of CCL18 and SAXS data and analysis CCL18.
Scattering curve (top, fitting and Rg calculated by program OLIGOMER, experimental Rg is calculated by Guinier approximation) and P(r) distribution (bottom, calculated by program GNOM) of CCL18 in (A) 20 mM citrate buffer, pH=5.5 and (B) 20 mM bicine buffer, pH=9.0. 1mg/ml protein was used to collect the SAXS data. Models used to fit the SAXS data were generated from CCL18 structure (4MHE). χ was calculated by Χ2 = [1/(N-1)] Σj{[μI(sj)-Iexp(sj)]/σ(sj)}2 where N is the number of experimental points and μ is the scaling factor. (C) Crystal packaging of CCL18 reveals two distinct oligomer arrangements, tetramer and open-ended polymer. Ribbon representation of possible structures of CCL18 tetramer. The acetate ion (ACT) and coordinating side chains of S32 residues are depicted as CPK. Ribbon representation of possible structures of CCL18 tetramer (C, bottom) and CCL18 hexamer (B, top). Composite iterative-build omit 2mFo-DFc map was calculated with Autobuild in PHENIX and contoured at 1σ. The scattering curve fitting and the fitting Rg were performed using Program OLIGOMER. The P(r) distribution and the estimated Dmax values were calculated using program GNOM.

