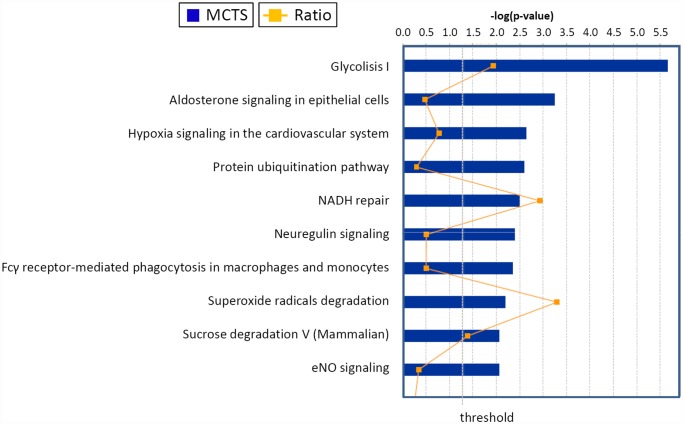
Fig 4. Top canonical pathways identified in cholangiocarcinoma cells EMT.
The graph represents host cell pathways with highest score (y-axis) based on the number of differentially regulated proteins using Ingenuity protein analysis. The bar graphs are the pathways most associated with the proteins altered. The orange line graph shows the ratio of the number of molecules from the differentially expressed proteins in EMT that are in the pathway relative to the total number of molecules in the pathway.

