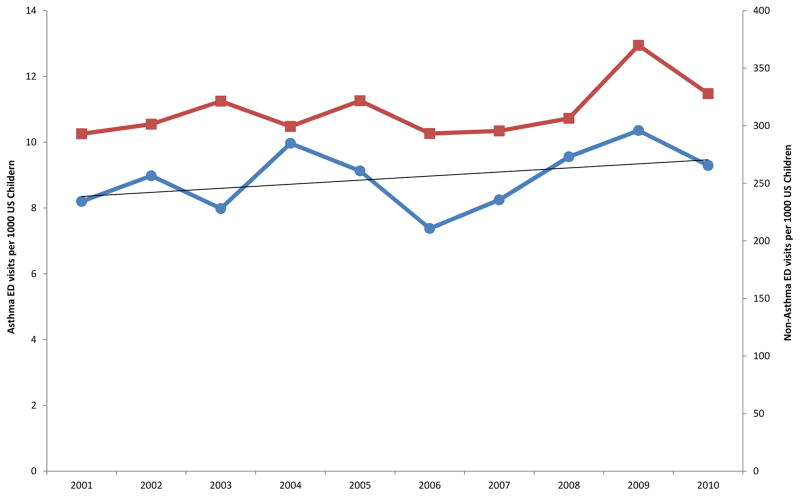
Figure 1.
Rates ED visits for potentially preventable asthma and non- potentially preventable asthma diagnoses by children ages 2–17, 2001–2010
Legend: Though ED visit rates for potentially preventable asthma diagnoses (blue line) rose from 8.2 per 1000 children in 2001 to 9.3 per 1000 in 2010 (13.3%) and other diagnoses (red line) diagnoses rose from 293 to 323 per 1000 (11.9%), there were many fluctuations and neither was statistically significant (p = 0.26 and 0.16, respectively).

