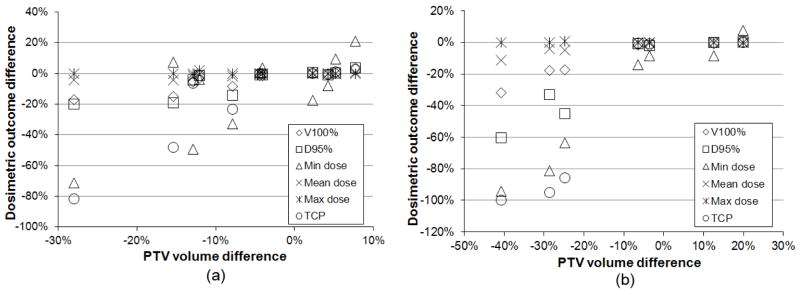
Fig. 3.

Dosimetric outcome changes due to PTV contouring variation. X axis represents the deviation of institutions’ PTV volume from consensus PTV volume, and Y axis represents the deviation of PTV dose parameters calculated with consensus contour from the parameters calculated with institutions’ contours. (a) Case1, (b) Case2.
