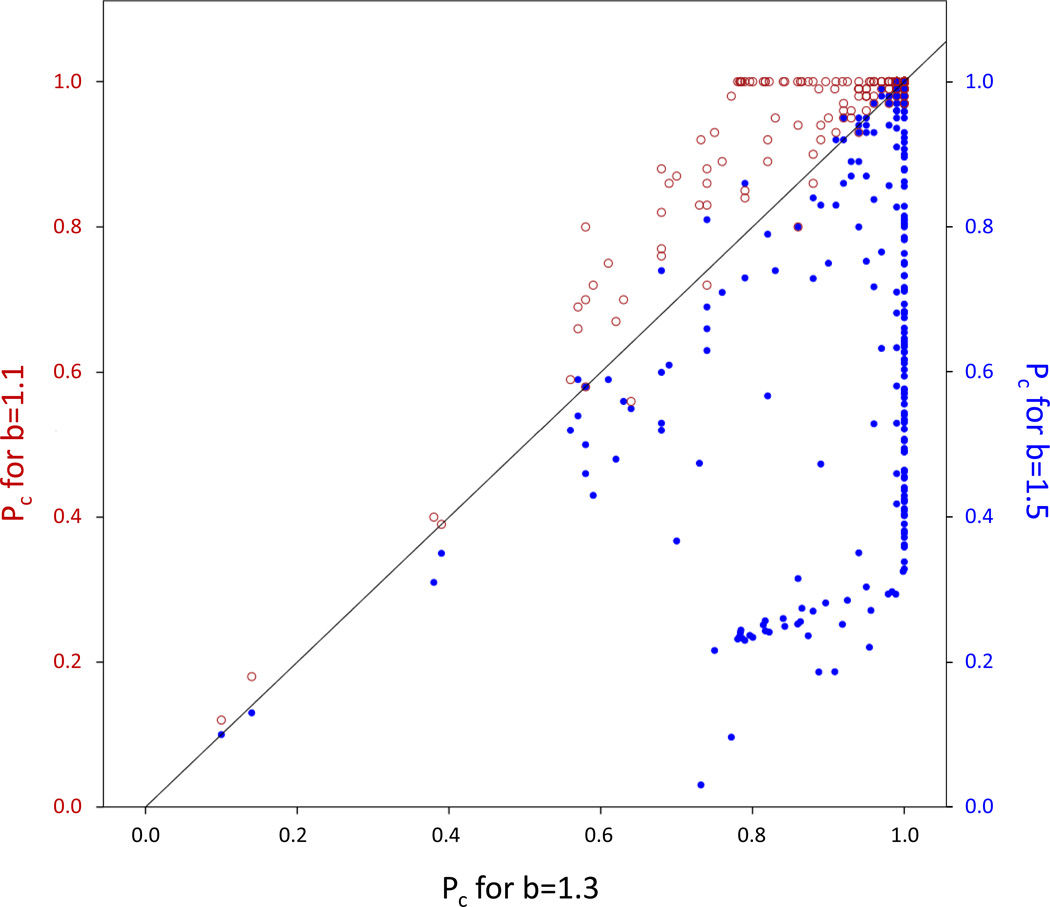
Figure 2.
The average proportion of cooperators at the end of the simulation, pc, shows a medium correlation between models that were run with different benefits to defect (b). As expected, pc was generally higher for b = 1.1 than for b = 1.3 (red hollow circles) and generally lower for b = 1.5 (blue solid circles) but several exceptions exist (below and above the diagonal, respectively).

