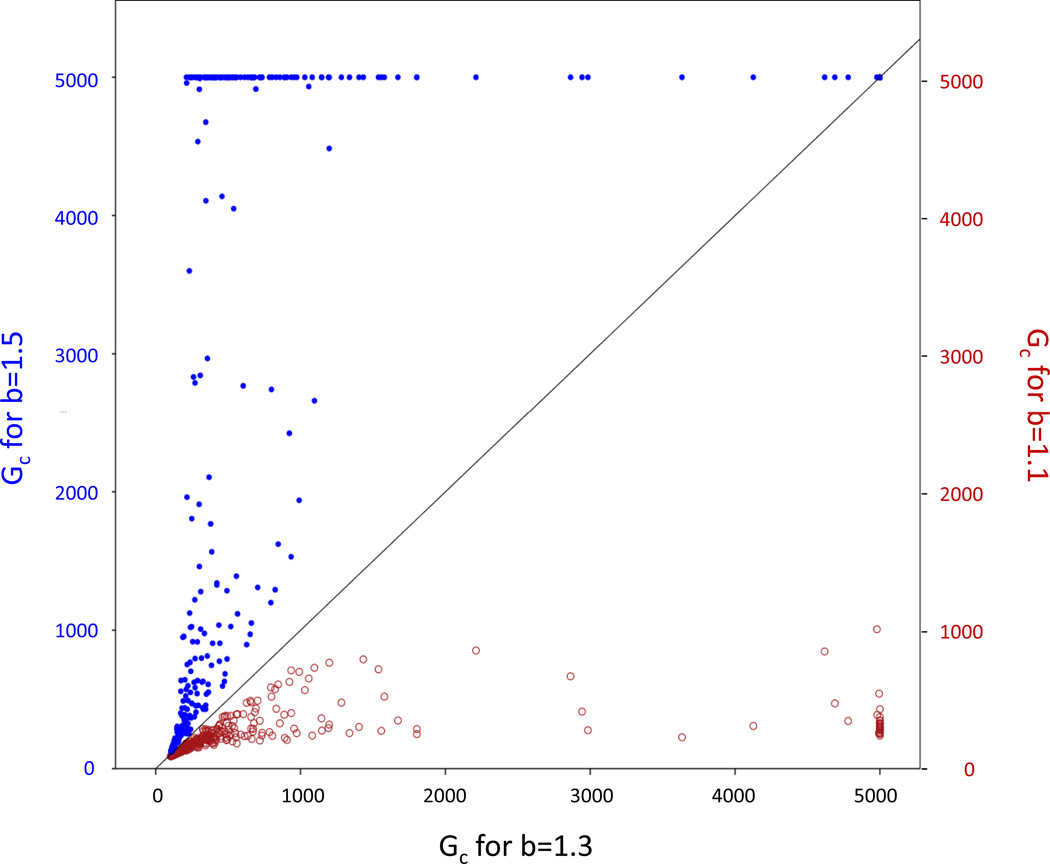
Figure 3.
In simulations that led to the persistence of cooperators, the average time to their fixation Gc was smaller for b = 1.1 than for b = 1.3 (red hollow circles) and larger for b = 1.5 (blue solid circles) without exception. A number of scenarios led to coexistence of cooperators and defectors and Gc = 5000 was defined in these cases because 5000 generations was the limit of each individual simulation.

