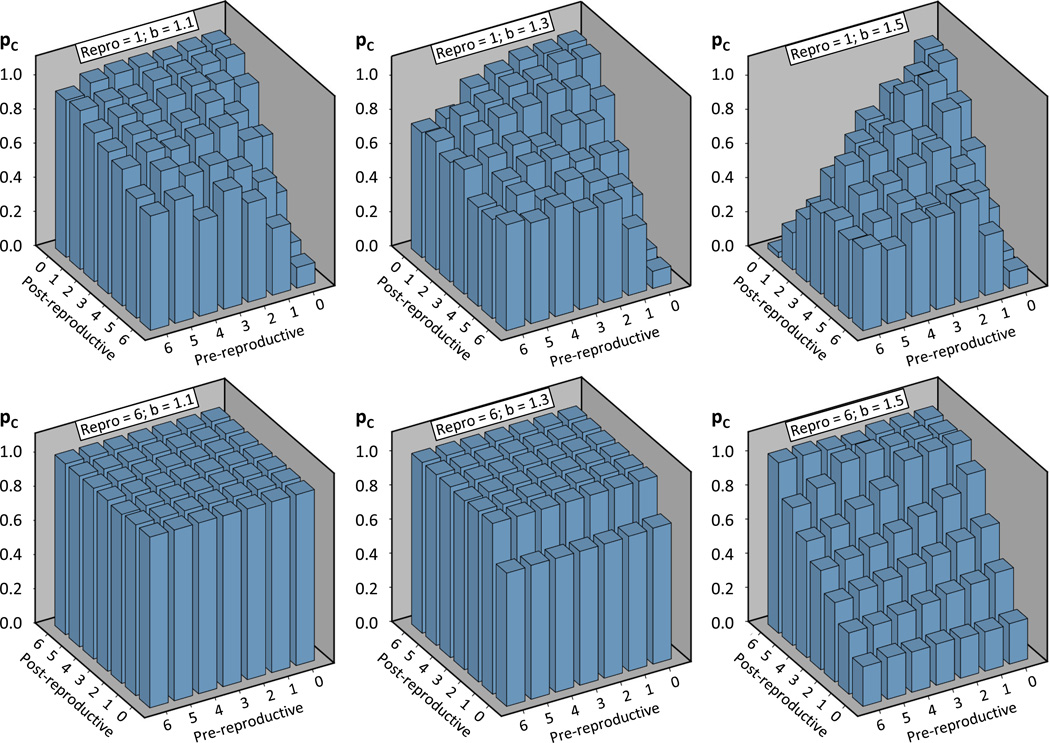
Figure 4.
The average proportion of cooperators in the simulated population was strongly influenced by the benefit to defect (b), the average duration of pre-reproductive, reproductive, and post-reproductive life span, as well as interactions between these four independent variables. To illustrate the main findings the interactive effects of b, pre-, and post-reproductive lifespan are shown here for the shortest (top row) and the longest (bottom row) reproductive duration. Note that the post-reproductive axis is inverted between the rows to improve the visualization of the results.

