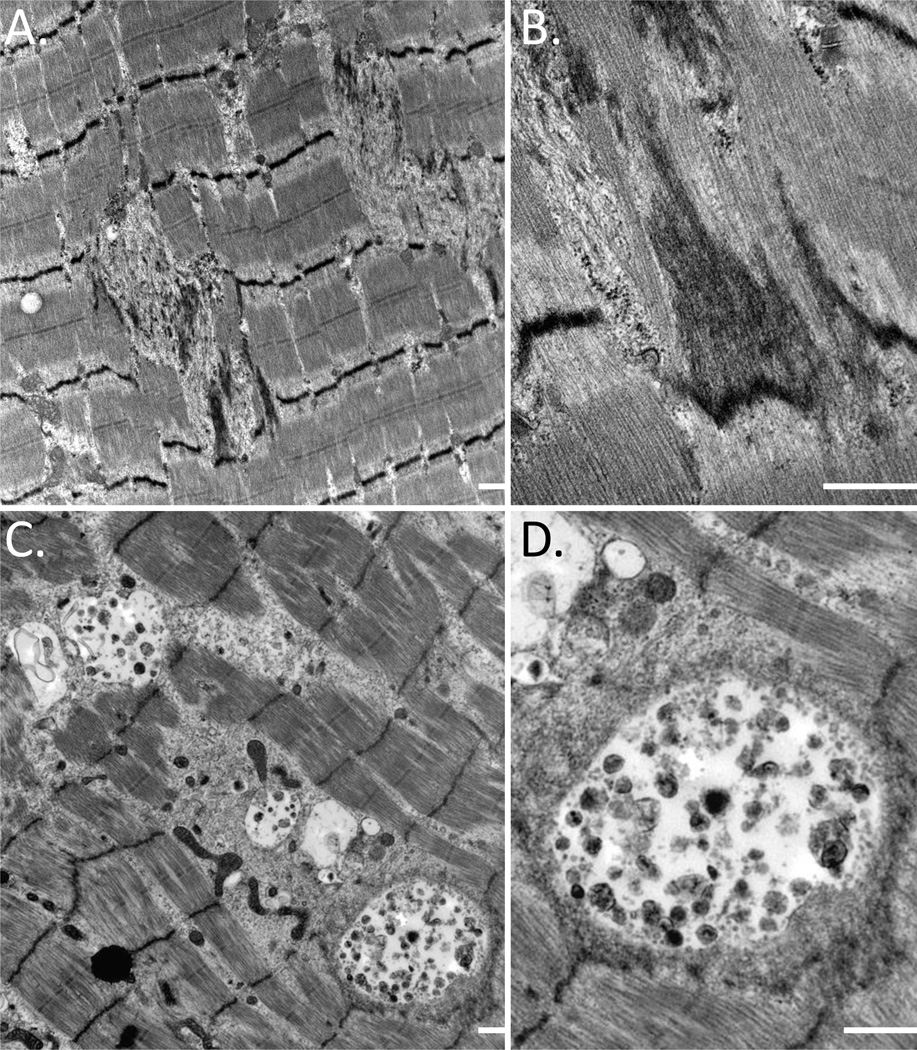
Figure 3.
A–B) Electron micrograph of skeletal muscle from the proband of Family 2 (III.3) demonstrating the accumulation of filamentous debris and Z-band streaming. C–D) Electron micrograph of skeletal muscle from the proband of Family 1 (III.1) with large autophagic vacuoles between myofibrils. Scale bar is 500 nM.

