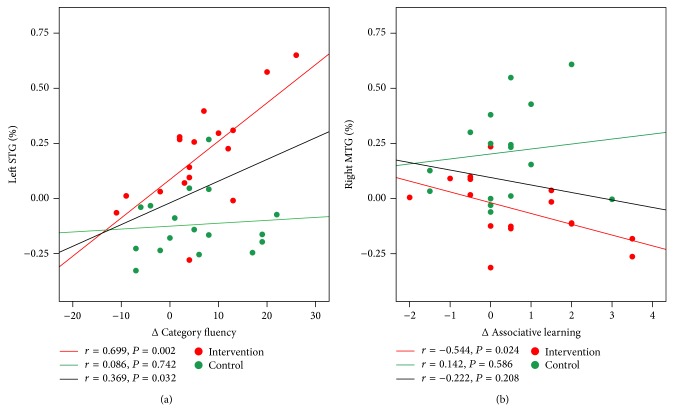
Figure 4.
Correlations between the intervention-related changes in ReHo of spontaneous brain activity and changes in cognitive performance for all participants. Data of the intervention group are colored in red and those of the controls are colored in green. The red fit line on each graph represents the relationship between the intervention-related changes in ReHo and cognitive performance in the intervention group, and the green fit line represents the relationship in the control group. The black fit line displays the relationship between the intervention-related changes in ReHo and cognitive performance for all participants from the two groups.

