Figure 2.

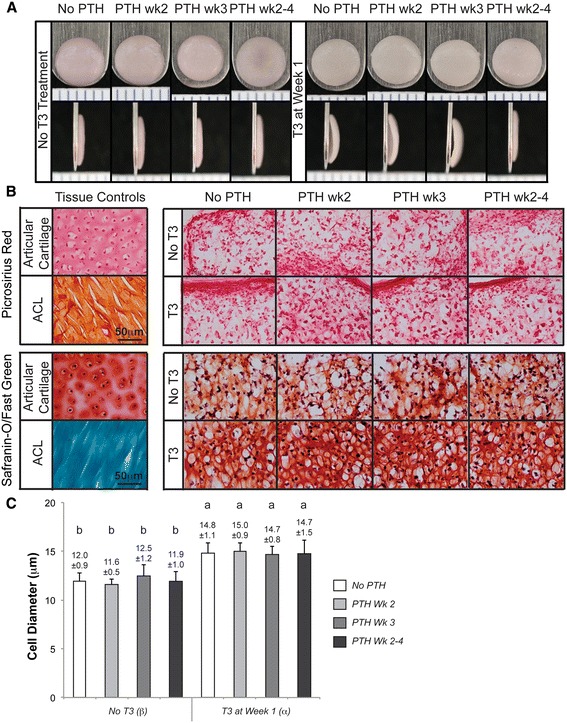
Phase 2 construct morphology, histological analysis, and cell diameter quantification. Phase 2 constructs exhibited no abnormalities and were hyaline-like in appearance. Notably, T3 treatment produced neocartilage with pronounced curvature, suggestive of tissue prestress (A). Picrosirius red and Safranin-O dyes demonstrated robust deposition of collagen and GAG, respectively, in all constructs (B). T3-treated groups possessed more GAG staining than non-T3 treated groups. T3 elicited an increase in cell diameter (C), as measured for cryoembedded, formalin-fixed samples. Groups not connected by the same letter are statistically significant. Data are represented as mean ± standard deviation. GAG, glycosaminoglycan; T3, tri-iodothyronine.
