
Figure 3.
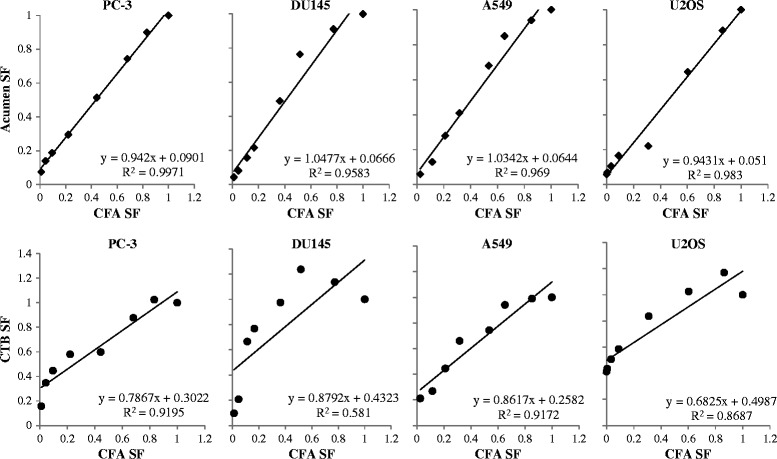
Correlation of IR dose-responses measured by automated cell counting or CTB metabolic activity assay to the CFA. Surviving fractions are derived from Figure 2. In each panel the SFs determined by CFA (x-axis) are plotted against the SFs determined by automated cell counting (Acumen; y-axis upper panels) or against the SFs determined by CTB assay (y-axis lower panels) for the indicated cell lines. The regression equation and correlation coefficient are given in each panel.