
Figure 4.
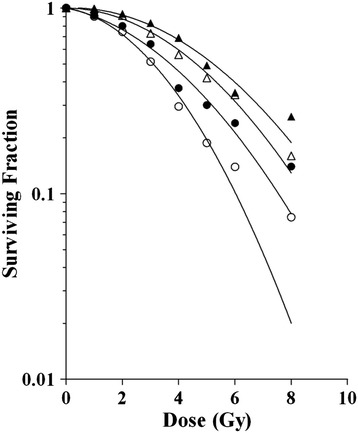
The effect of cell density on the irradiation dose–response measured by automated cell counting. Dose-responses of PC-3 cells seeded 500 cells/well (open circles); 750 cells/well (closed circles); 1,000 cells/well (open triangles); or 1,500 cells/well (closed triangles) and irradiated 0–8 Gy. Graphs were prepared by fitting the data to the linear quadratic model. Correlation coefficients were above 0.98 for all graphs.