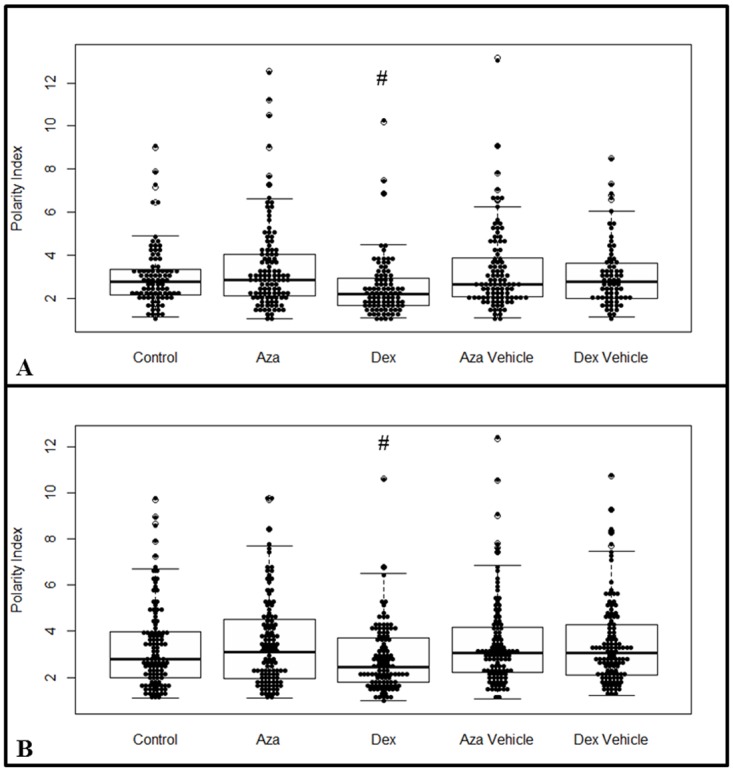
Fig 4. Cell Polarity Index.

MSCs were cultured for 24 h (A) or 7 d (B) with or without AZA 1 μM or DEX 10 μM, and their polarity index was measured according to S1 Fig. PI values were obtained from 80–100 cells (n = 4), and the results showed that DEX treatment induced a more rounded cell shape (# P < 0.05), while AZA showed a tendency to induce more elongated cells when compared to the control group. Graphs present the median value between the lower and upper quartiles, while showing the variability outside this range. The polarity index assay was analyzed using Kruskal-Wallis post-hoc Dunn.
