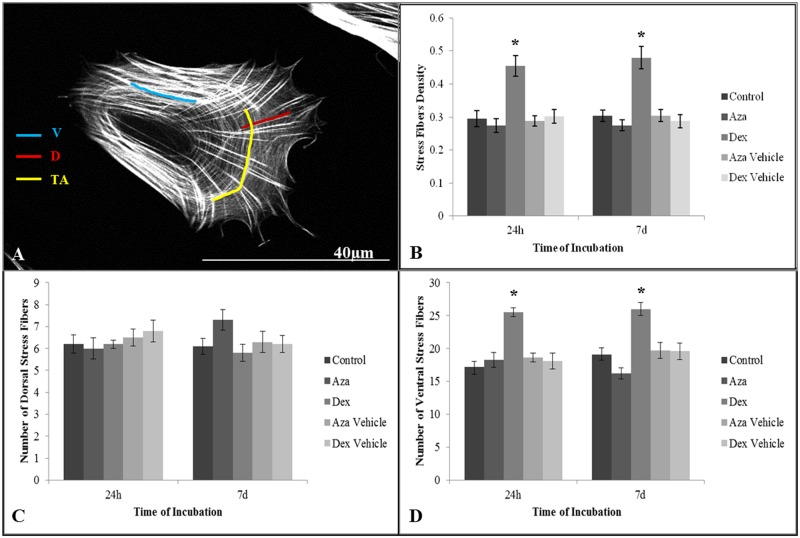
Fig 6. Actin analysis.
MSCs were cultured for 24 h or 7 d with or without drugs and stained with rhodamine-phalloidin in order quantify actin density and dorsal or ventral stress fibers (A) through Image J. MSCs treated with DEX presented an increase in actin density (B), consistent with a higher presence of ventral actin stress fibers (D). None of the drugs seemed to alter significantly the presence of dorsal stress fibers (C), while AZA did not show any difference in actin density (B) and ventral stress fibers (D). *P < 0.05, n = 20. D = Dorsal stress fibers; V = Ventral stress fibers; TA = Transversal arcs of stress fibers. Actin quantification was analyzed through ANOVA post-hoc SNK. Bar = 40 μm.

