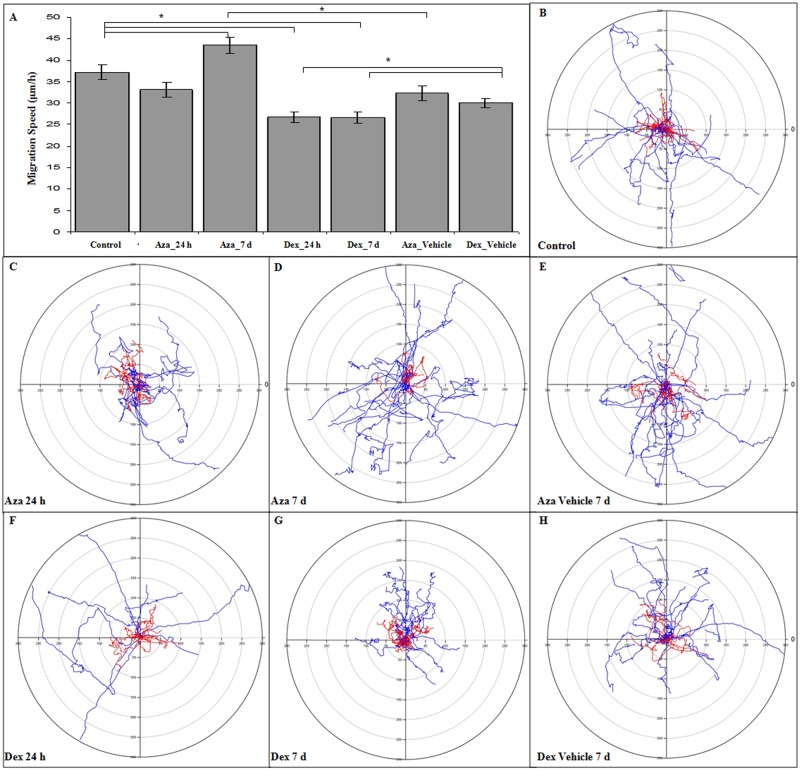
Fig 7. MSC migration speed and spatial trajectory.
MSCs were cultured for 24 h or 7 d with or without AZA 1 μM or DEX 10 μM, plated on fibronectin 2 μg/mL and imaged using time-lapse analysis. (A) DEX treatment induced a decrease in migration speed, while AZA was associated with a faster motility property. The ST of each migratory cell was accessed through the use of X and Y values, which were normalized to start at a virtual migratory starting point (X = 0 and Y = 0) (B-H). Individual lines on polar plots represent the ST of each cell, while red lines represent cells that stayed close to the starting point and blue lines represent cells that were more exploratory. DEX-treated cells were associated with a lower ST, while AZA showed a tendency to induce a more exploratory phenotype. *P < 0.05, n = 4. MSC migration speed was analyzed through ANOVA post-hoc Tukey HSD, and comparisons were made between all groups; the differences among the main groups are represented in the graphic.

