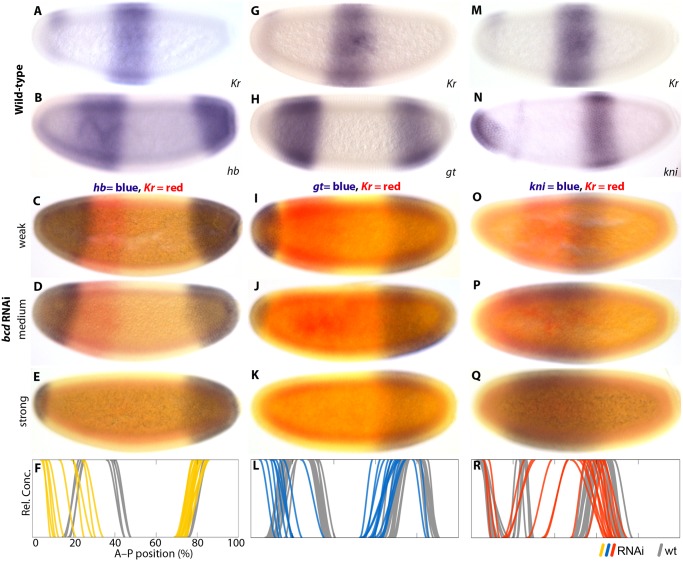
Fig 4. Gap gene expression in response to bcd RNAi knock-down.
Columns show wild-type (A,B,G,H,M,N) or bcd RNAi embryos (C–E,I–K,O–Q) single- or double-stained for Kr (A,C–E,G,I–K,M,O–Q) along with hb (B–F), gt (H–L), and kni (N–R) as indicated. (F,L,R) Summary graphs comparing wild-type boundary positions (wt; grey lines) to boundary positions affected by RNAi (coloured lines). Kr is stained in red (C–E, I–K, O–Q) or blue (A,G,M). Other stains as indicated. All embryos are at time class T4 (hb and kni columns) or T3 (gt column). Embryo images show lateral views: anterior is to the left, dorsal is up.

