
Fig 8. RNAi double knock-down of M. abdita bcd and cad.
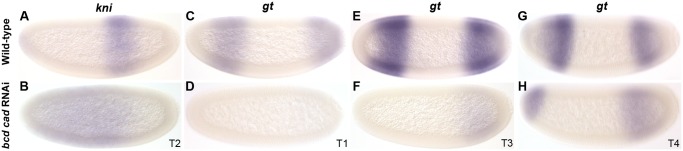
Columns show the expression of kni (A, B), and gt (C–H) in wild-type embryos (top row: A, C, E, G), and in embryos treated simultaneously with bcd and cad RNAi (bottom row: B, D, F, H). Embryo time classes as indicated at bottom right of each column. Embryo images show lateral views: anterior is to the left, dorsal is up.