
Figure 6.
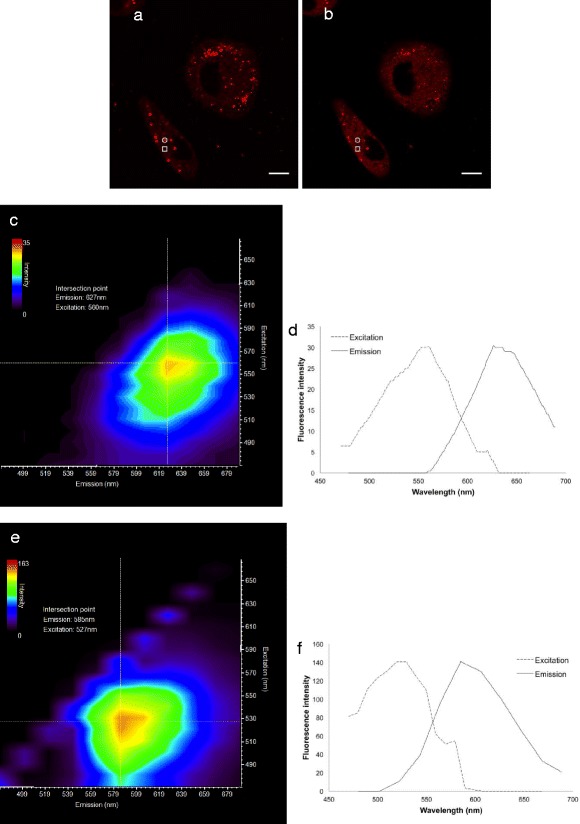
CLSM fluorescence imaging and excitation-emission-scans of cells incubated with nanoparticles for 1 h. Scale bars are 10 μm. Nile Red was excited at 488 nm and 542 nm with a white light laser, and fluorescence was detected at 550–590 nm (a) and at 650–720 nm (b). An excitation-emission-scan was captured, and from the two regions of interest shown in the image, the excitation and emission intensity maps were obtained from the cytosol (c) and from a vesicular structure (e). Corresponding excitation and emission spectra from the intensity maxima of the maps are shown in (d) and (f), respectively.