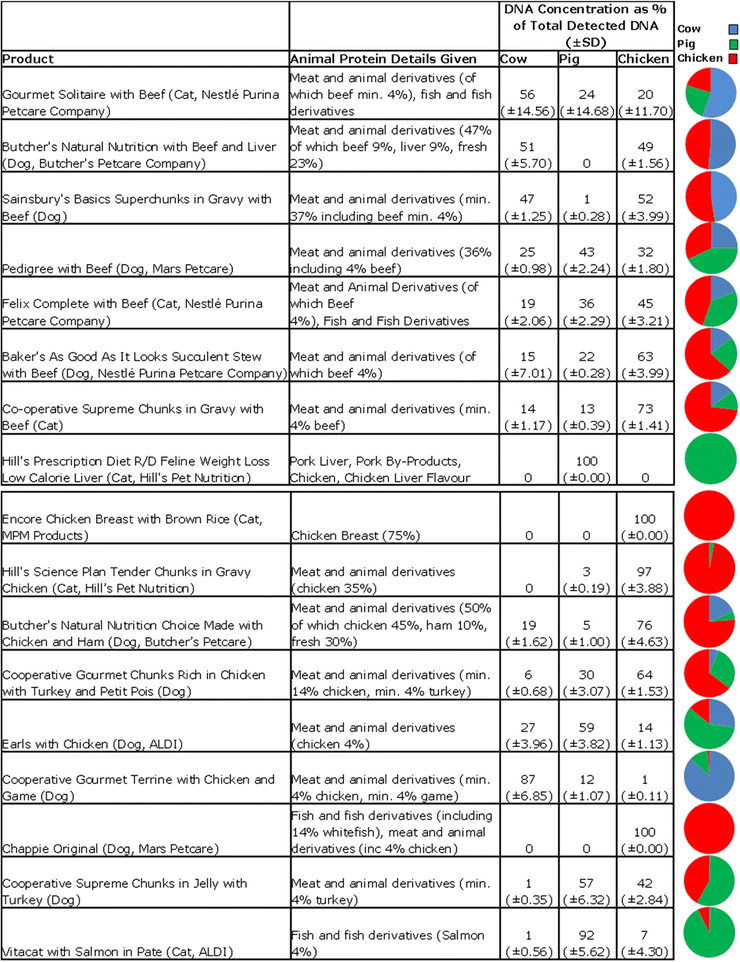
Table 2.
Protein information on product labels provided partial disclosure of animal species of origin

|
Each product shows headline label description and animal protein details provided by manufacturers. The relative amount of DNA detected for each host species tested for (listed in Table 1) was calculated as a percentage of total detected DNA. SD = standard deviation. *Fish DNA was not tested for in this study. The pie charts represent the proportion of the ingredients in relation to each other, and not the percentage of each ingredient in the whole product. Fish and turkey DNA were not tested in this study.
