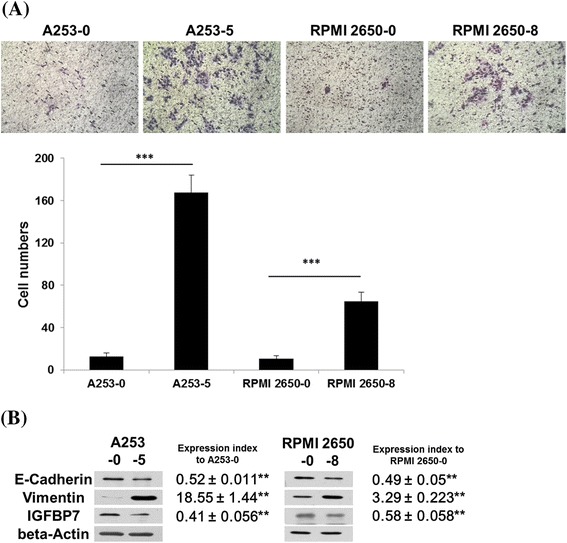
Figure 1.

Characterizations of invasive subpopulation of HNSCC cell lines. (A) The invasion assay of A253, RPMI 2650 and their invasive subpopulations. Images show that the cells invaded through the Matrigel coated membrane at a magnification of ×50. (B) Protein expression of EMT related genes and IGFBP-7 in A253, RPMI 2650 and their invasive subpopulations. Expression index was normalized with beta-actin and ratio to A253 or RPMI 2650, respectively. ** indicated p < 0.01; *** indicated p < 0.001.
