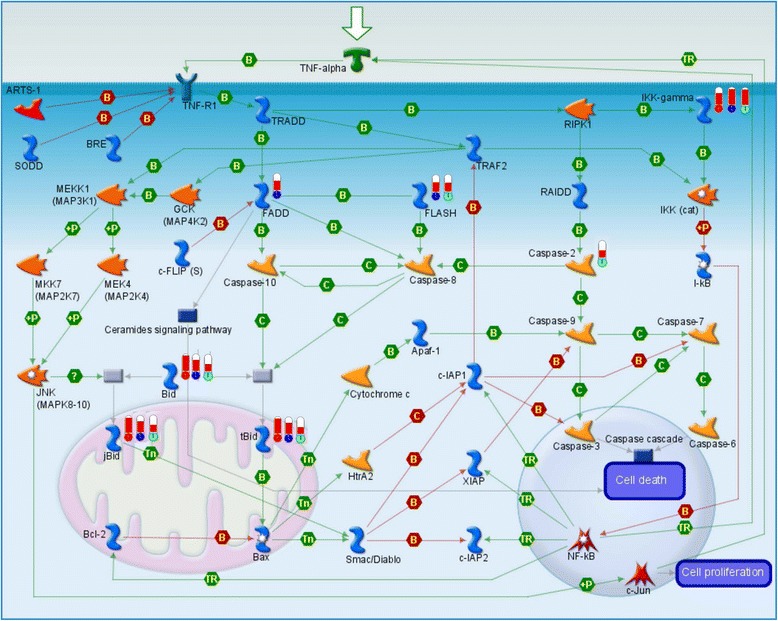
Figure 2.

Change in TNFR1 signaling pathway in 3 h, 12 h, and 24 h groups after cerebral ischemia-reperfusion injury. Upward thermometers have red color and indicate up-regulated expression levels of the genes. The circles at the base of the thermometers in red, blue, and green represent significantly differential expressions in the 3 h, 12 h, and 24 h groups, respectively.
