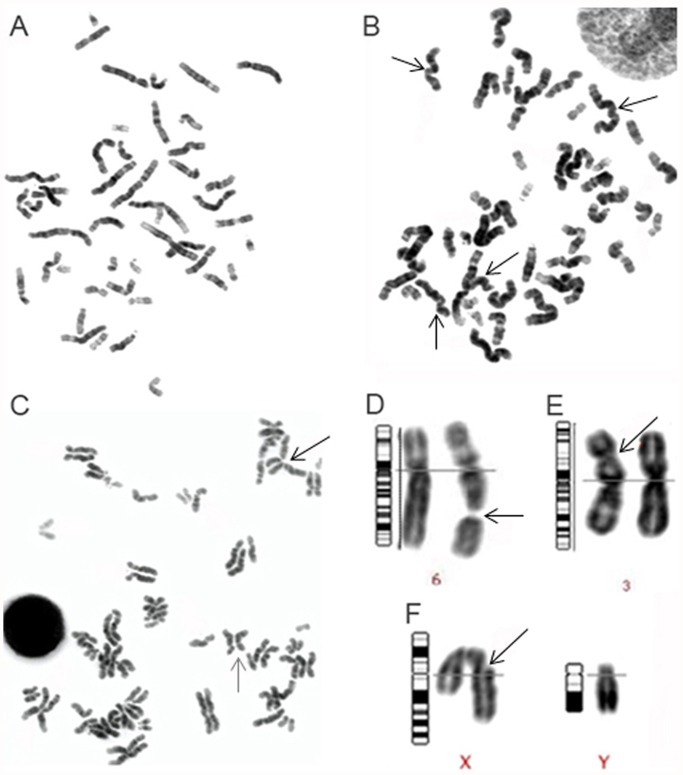
Fig 1. Chromosomal aberrations observed following exposure to genotoxic agents.
Panels A-F provides representative examples of karyotypes and different chromosomal aberrations observed after genotoxic exposure. Panels A-C depict individual metaphase spreads. Panels D-F provides examples of individual chromosome pairs with specific chromosome aberrations (magnified). A description of each panel follows: (A) Normal 46, XX metaphase spread; (B) Metaphase spread displaying distorted pulverized chromosomes with altered morphology, indistinct banding pattern and indistinguishable centromeres (several examples are indicated by arrows); (C) Metaphase spread demonstrating premature sister-chromatid separation (e.g. black arrow) and premature centromere separation (e.g. gray arrow); (D) Gap in chromosome 6; (E) Dicentric chromosome 3 at band 3p21; and (F) Chromatid break in the X chromosome at band Xq21.

