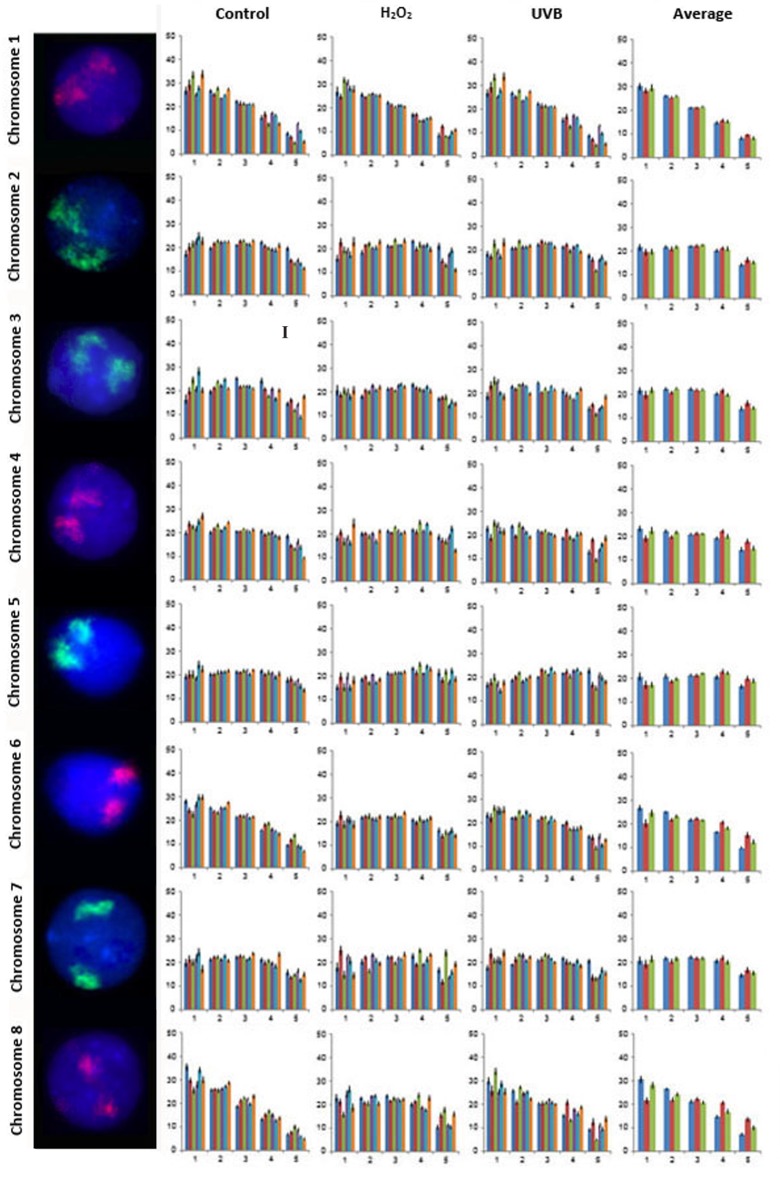
Fig 2. Radial distribution for chromosomes 1–8 in six subjects in unexposed, H2O2 and UVB exposed lymphocytes.
Fig. 2 displays representative FISH images and the radial distribution for CTs 1–8. Note FISH experiments were dual color, for simplicity only a single fluorochrome (CT) is displayed in each lymphocyte (the second fluorochome was removed by deselecting either the red or green channel). Moving from left to right the chromosome number is indicated followed by a representative FISH image for the CT and four histograms. The X-axis for all histograms represents each of the five rings of equal area (1–5, nuclear interior to nuclear periphery [left to right]). The Y-axis for all histograms represents the proportion of fluorescence (%). Error bars represent the standard error of the mean (SEM). The first, second and third histogram display the radial distribution for each CT in control, H2O2 and UVB exposed lymphocytes, respectively. Each of these histograms contain six bars for the five rings, corresponding to each of the six subjects (1 to 6, left to right). The fourth histogram displays the average radial distribution for the six subjects in unexposed (blue), H2O2 (red) and UVB (green) exposed lymphocytes. Roman numerals indicate significant inter-individual variations in radial distributions (p<0.05) between subjects in control lymphocytes: I- CT3 subject 5 (different to subjects 1 and 6).

