Figure 1.

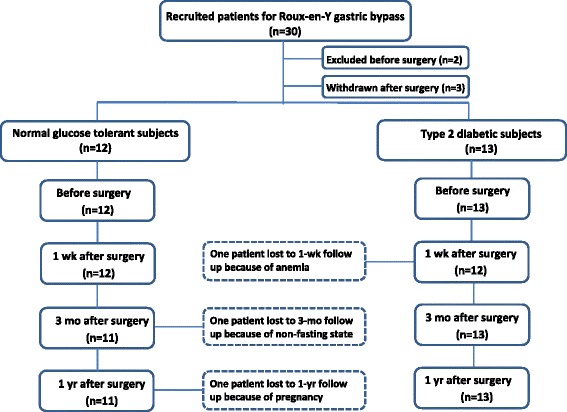
Trial profile. Numbers of subjects initially enrolled are depicted and subject disposition (number of T2D vs NGT subjects, subjects who were excluded or withdrawn, and subjects who were lost to follow up) is described.

Trial profile. Numbers of subjects initially enrolled are depicted and subject disposition (number of T2D vs NGT subjects, subjects who were excluded or withdrawn, and subjects who were lost to follow up) is described.