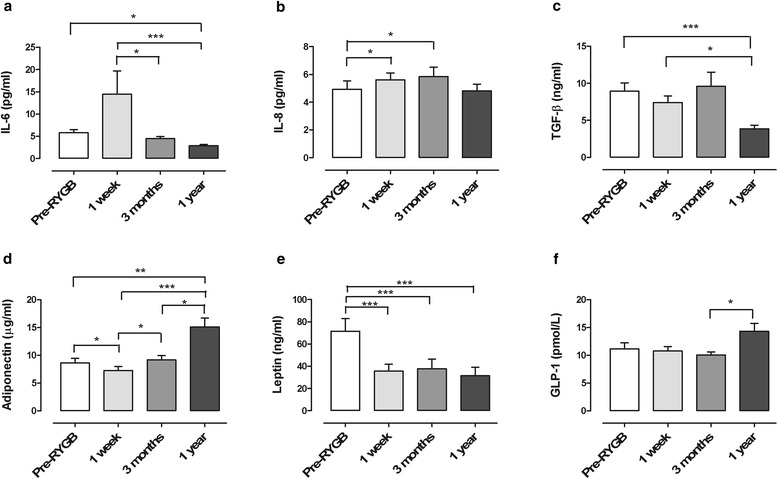
Figure 2.

a-f Fasting plasma concentrations of inflammatory cytokines and GLP. Fasting plasma concentrations of (a) IL-6 (N = 18), (b) IL-8 (N = 18), (c) TGF-β (N = 22), (d) adiponectin (N = 20), (e) leptin (N = 18), and (f) GLP-1 (N = 21) before (Pre-RYGB), one week, three months, and one year after Roux-en-Y gastric bypass in the whole study population. Data are presented as mean ± SEM. Only patients with complete fasting data set (samples drawn at all four time points) were included. Comparisons between time-points was made using ANOVA (non-parametric Friedman test for repeated measures) followed by Dunn’s multiple test for statistical differences, *P < 0.05, **P < 0.01, ***P < 0.001.
