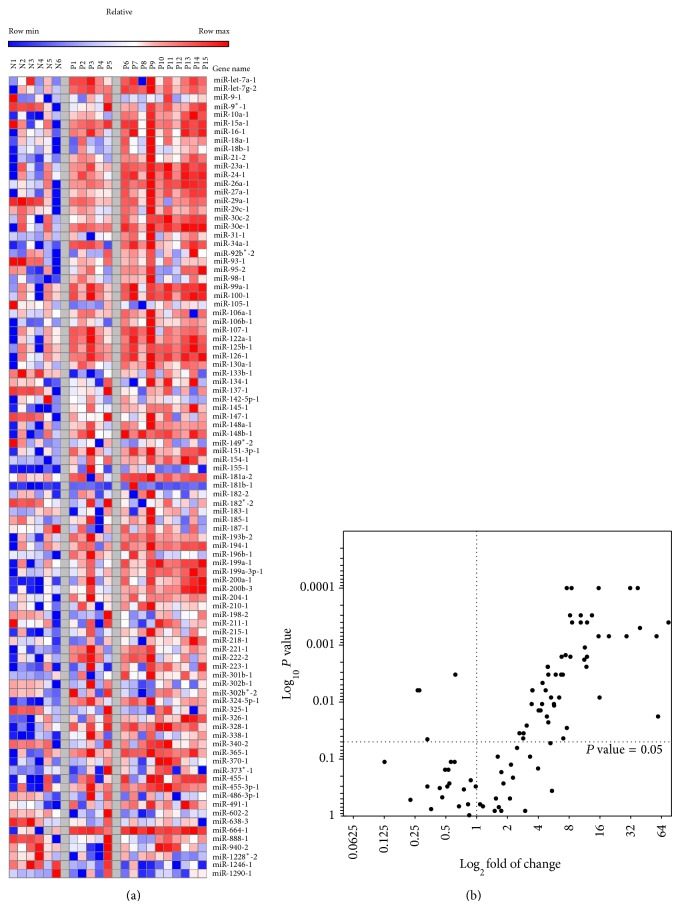
Figure 1.
Profiling of 94 miRNA expression patterns in advanced HCC Egyptian patients compared to normal subjects. Expression of 94 miRNAs was determined by real-time PCR in specimens of normal controls (n = 10) and HCC patients (n = 15). (a) Heatmap of expression profile of 94 miRNAs in HCC patients (P1–P15) and normal donors (N1–N6). (b) Volcano plot of relative gene expression fold of change of the 93 miRNA versus P value. Fold of change is represented in log2 ratio in the x-axis versus P value represented in log10 ratio in the y-axis.

