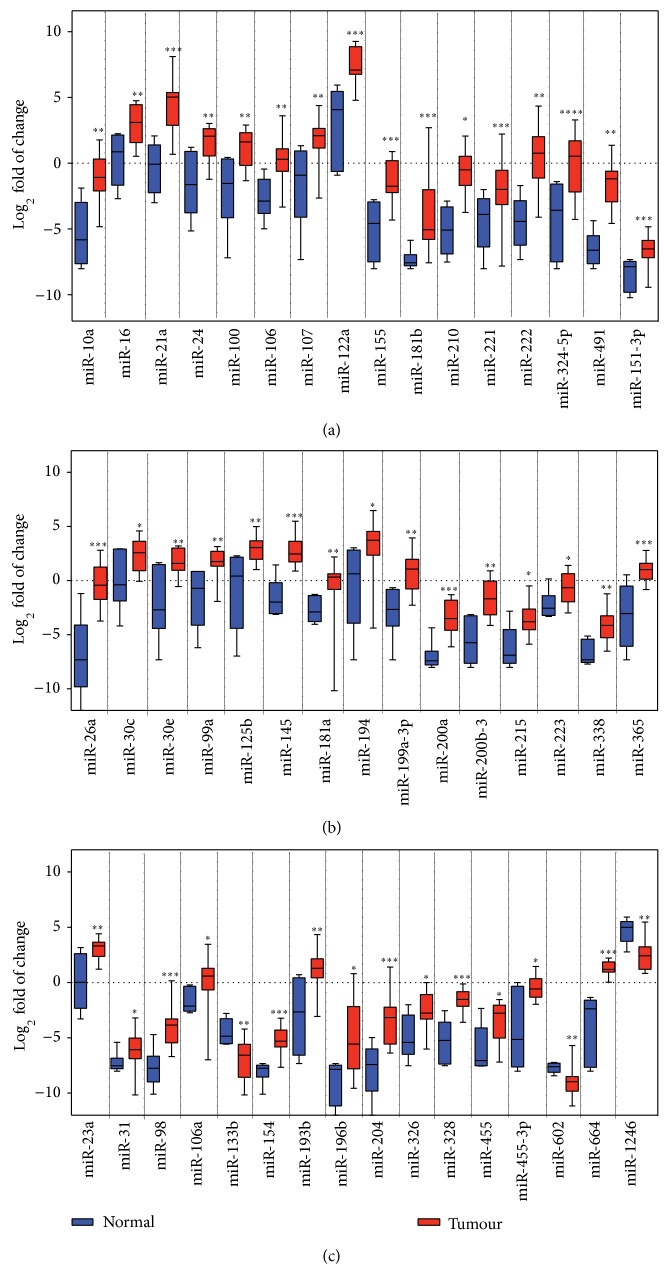
Figure 2.
Comparison of miRNA profiles significantly deregulated in our study with published HCC studies. Boxplots of mean miRNA expression after control-based normalization are shown in all panels. Black bars indicate the median. * P < 0.05, ** P < 0.01, and *** P < 0.001 are based on nonparametric Mann-Whitney tests comparing between miRNA expression levels in normal and tumours. (a) miRNA regulated in our study but not reported in other HCC studies. (b) miRNAs upregulated in our study and upregulated in other HCC studies. (c) miRNAs upregulated in our study and downregulated in other HCC studies.

