Figure 4.
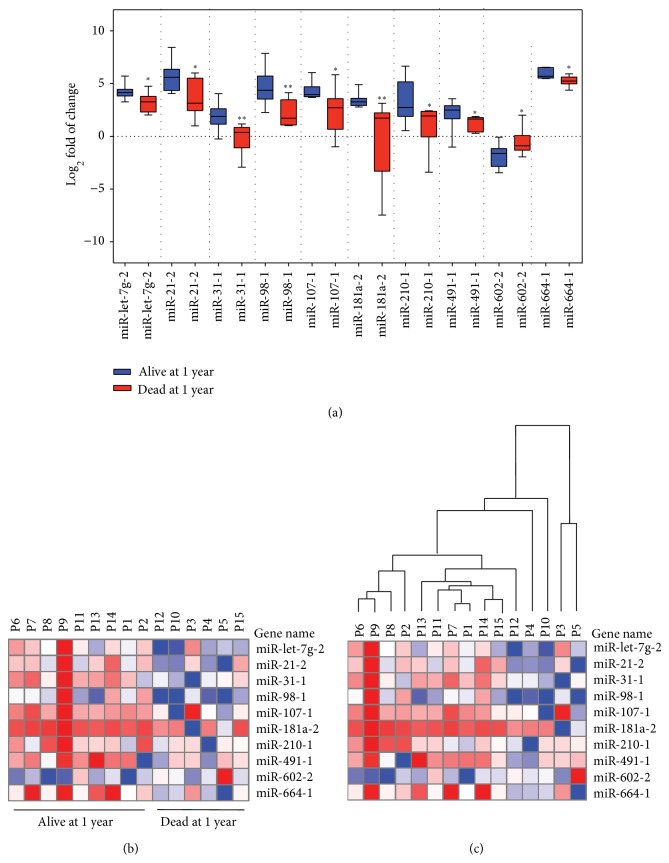
miRNA expression profile associated with patients' survival status at 1 year. Expression of miRNAs was determined by real-time PCR in HCC patients. Expression profiles were normalized against normal controls. Log2 fold of change of miRNA was compared in HCC patients at one year of survival. (a) Graph shows 10 miRNAs that were significantly deregulated in association with survival status of patients at one year. (b) Heatmap of expression profile of 10 miRNAs in (a). (c) Hierarchical clustering with the 10 altered miRNAs showed a clear separation between alive and dead groups.

