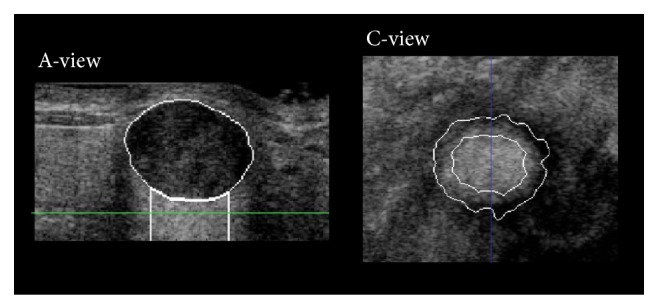
Figure 3.

Sonographic A-view and C-view images of a tumor mass and its posterior region. The posterior region is the area under the tumor in the A-view image. The C-view image shows the section contour of the tumor lesion (external curve) and the section contour of the posterior regions (internal curve). The blue line in the C-view image indicates the plane of the A-view image. The green line in the A-view image indicates the plane of the C-view image.
