Figure 3.

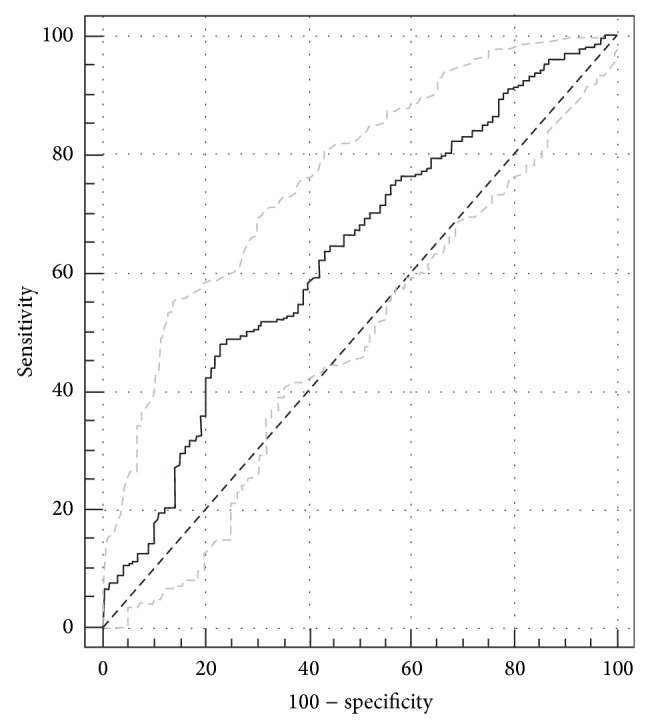
ROC curve of the true positive rate (sensitivity), false positive rate (100-specificity) predictive values of the IL28B serum level concentration among patients infected with HCV and individual with liver cirrhosis+HCC patients.

ROC curve of the true positive rate (sensitivity), false positive rate (100-specificity) predictive values of the IL28B serum level concentration among patients infected with HCV and individual with liver cirrhosis+HCC patients.