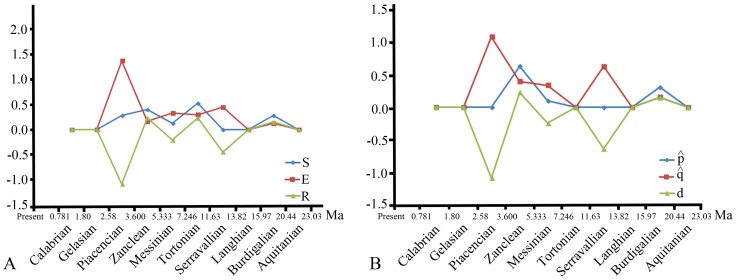
Figure 2. Instantaneous deterministic (A) and per-capita (B) rates for rhizomyine speciation, extinction, and biodiversity change calculated using phylogenetically constrained species ranges (see material and methods).
Biodiversity rises in the Burdigalian, Tortonian, and Zanclean are driven by an increase in the speciation rates coupled with a lower extinction rate during the Tortonian. The three drops in biodiversity in the Serravallian, Messinian, and Zanclean are the result of elevated extinction rates.

