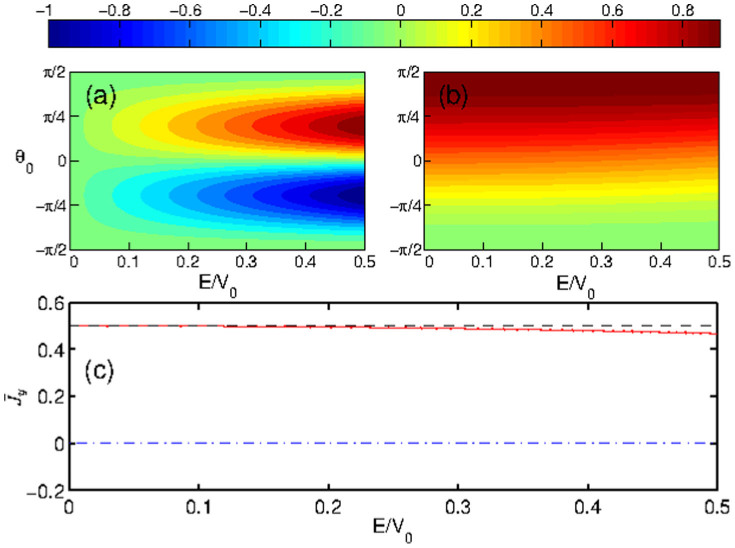
Figure 6.
Comparison of the y-component of the current density (coded by colors) as a function of the incident angle θ0 and the height of the reduced potential barrier E/V0 between the nonrelativistic (a) and relativistic (b) cases at the interface (x = 0). (c) The y-component of the current density averaged over all possible incident angles θ0 as a function of E/V0: blue dash-dotted (red) curve is for the nonrelativistic (relativistic) case and the dash black line denotes the theoretical estimation of the relativistic case based on Eq. (26) with the assumption  . In both cases, the values of the current density have been normalized by the respective maxima.

