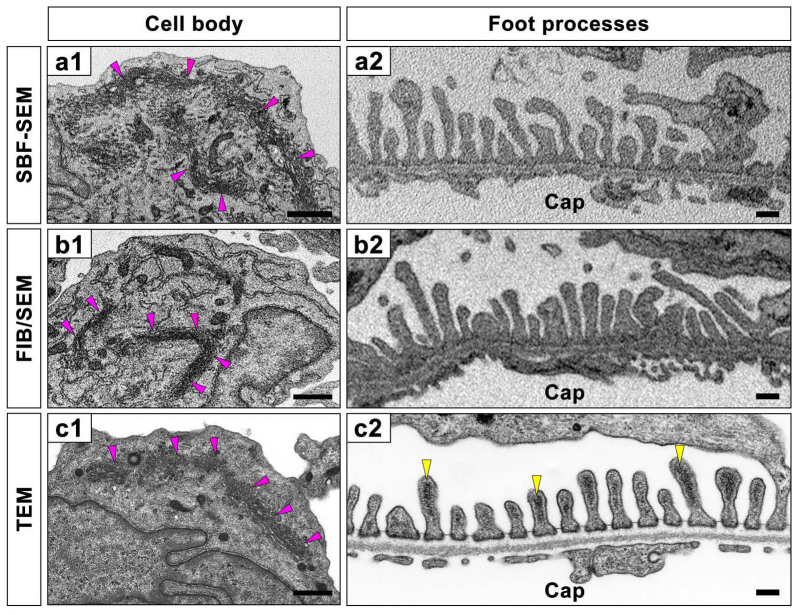
Figure 2. Comparison with block-face SEM and conventional TEM images of podocytes.
The block-face images obtained with SBF-SEM (a1, a2) and FIB/SEM (b1, b2) are similar to the conventional TEM images (c1, c2). Due to the combinatorial heavy metal en bloc staining, the Golgi apparatus and endoplasmic reticulum in the cell bodies of podocytes are electron-densely depicted (pink arrowheads in a1, b1, c1). The electron-dense actin bundles, which are visualized at the luminal cytoplasm of the foot processes in the conventional TEM image (yellow arrowheads in c2), are difficult to see in the FIB/SEM and SBF-SEM images. Cap, capillary lumen. Bar scales, 500 nm in (a1), (b1), (c1); 200 nm in (a2), (b2), (c2).

