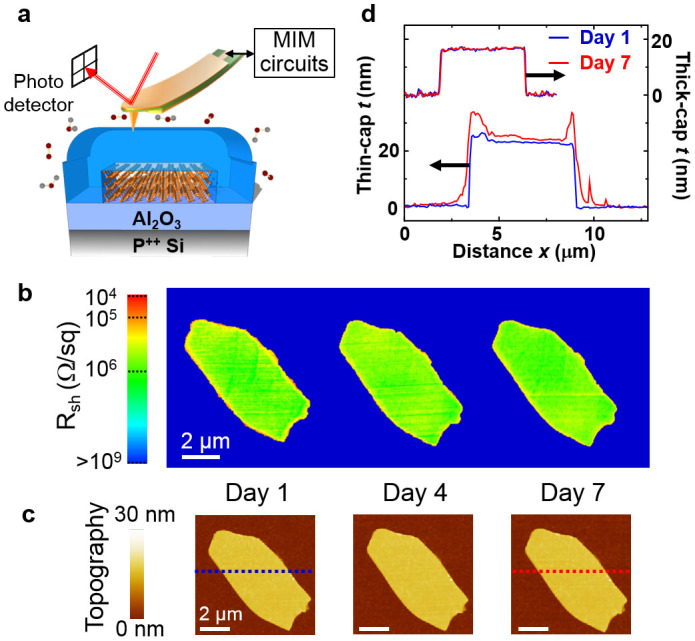
Figure 3. Spatial and temporal evolution of black phosphorus with thick dielectric capping.

(a) Schematic of BP sample on Al2O3/Si substrate with a thick Al2O3 capping layer against oxygen and moisture in the ambient. The MIM setup is also illustrated. (b) Sheet resistance maps approximated by the MIM-Real data of a 16 nm-thick flake capped by 25 nm Al2O3. The images were acquired daily over one week. (c) AFM topography of the same flake taken during the same time duration. Neither MIM nor AFM showed discernible changes throughout this period. (d) AFM line profile of thin-cap (bottom) and thick-cap (top) samples. The blue and red lines are associated with Day 1 and Day 7, respectively. Substantial increase in thickness is seen at the edges of the thin-cap sample, while little change is observed for the sample with thick capping. All scale bars are 2 μm.
