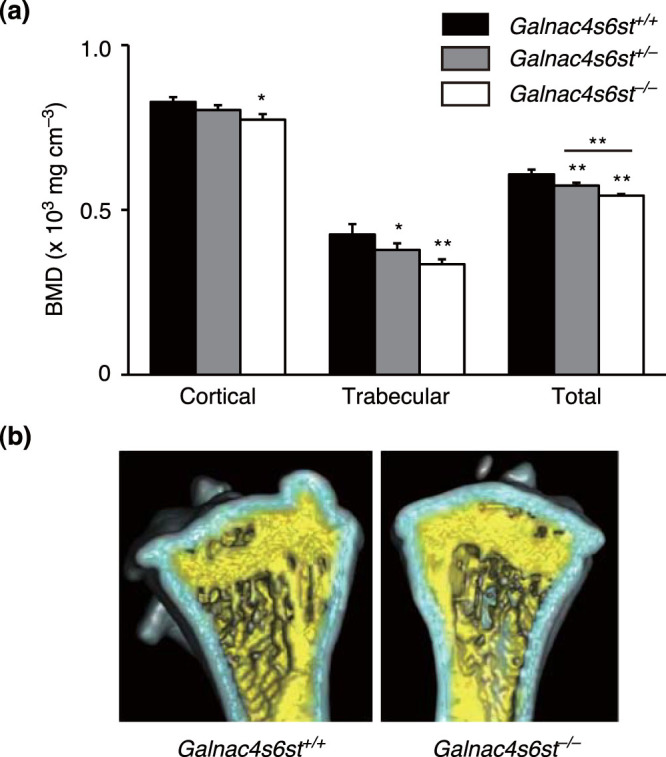
Figure 3. Osteopenic/osteoporotic phenotypes of Galnac4s6st−/− mice.

(a,b) μCT analysis of tibias from 16-week-old male Galnac4s6st+/+ (WT), Galnac4s6st+/−, or Galnac4s6st−/− mice. μ-CT-derived measurement of BMD (a, n = 3 bones total, each from different litters). Data are represented as mean ± s.d. *, P < 0.05; **, P < 0.01, Tukey-Kramer test. Medial, longitudinal section through a μCT-generated three-dimensional reconstruction of a tibia (b). The cortical and trabecular regions are pseudo-colored light blue and yellow, respectively.
