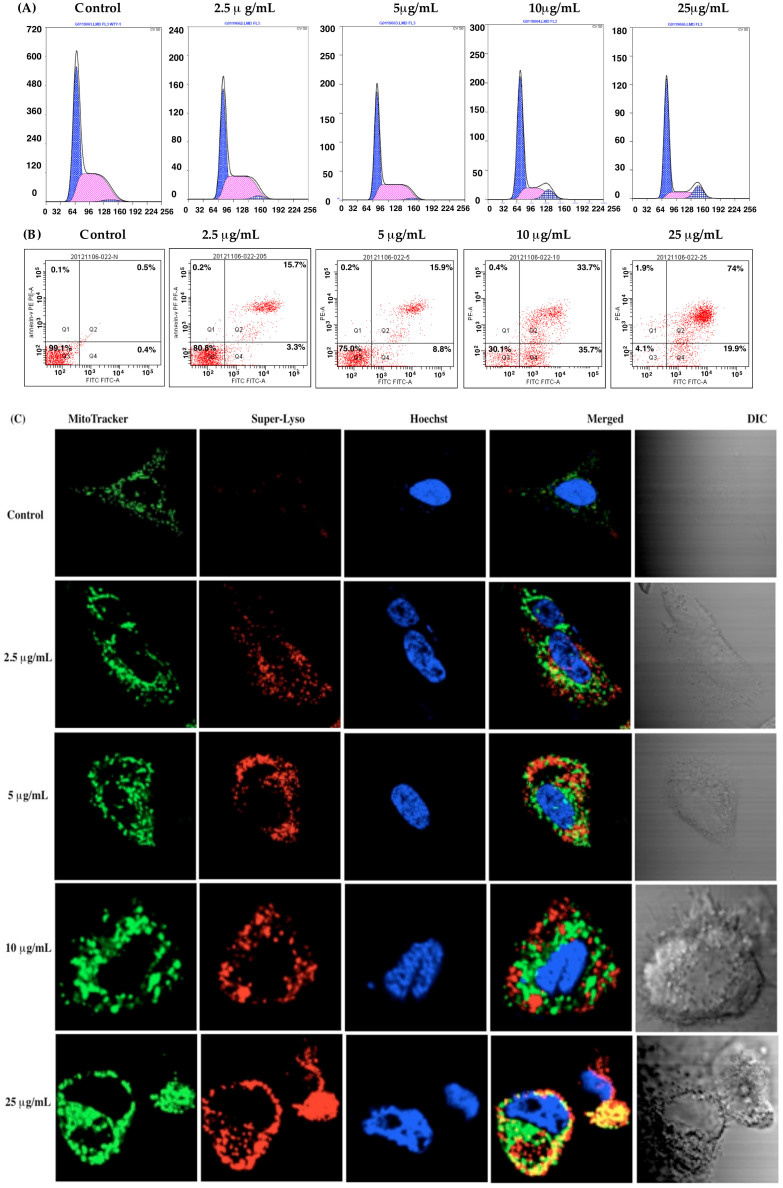
Figure 8. Effect of lobaplatin treatment in human cholangiocarcinoma RBE cells.
(A) RBE cells were exposed to various concentrations of lobaplatin for 24 h followed by analysis of the cell cycle via flow cytometry; (B) RBE cells were exposed to various concentrations of lobaplatin for 24 h and followed by flow cytometry analysis using the Annexin V-FITC apoptosis detection kit; (C) Confocal fluorescent laser scanning images showing mitochondrial and lysosomal changes in RBE cells following treatment with lobaplatin (2.5 ~ 25 μg/mL). RBE cells were counterstained with Superior LysoProbe (IV) (1 μM, red), Hoechst 33342 (1 μg/mL) and MitoTracker (80 nM). Cells were imaged on an inverted laser scanning fluorescent microscope (Olympus) using a 60 × oil immersion objective lens.

