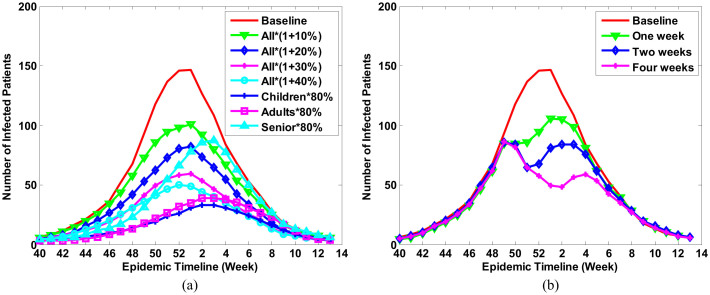
Figure 4. Simulation of the influenza epidemic curve with different interventions.
(a) Vaccination. Seven scenarios were simulated for this intervention. In the first four scenarios, the coverage of vaccination is enlarged by 10%, 20%, 30%, and 40% in all population, respectively. In the last three scenarios, the coverage of vaccination was set as 80% in children, adults, and seniors, respectively; and (b) School closure. Three scenarios were simulated in which the length of school closure was one week, two weeks, and four weeks. The time of school closure started when more than 0.1% of populations go to a hospital due to influenza infection. Baseline means there was no intervention and R0 = 1.26.

