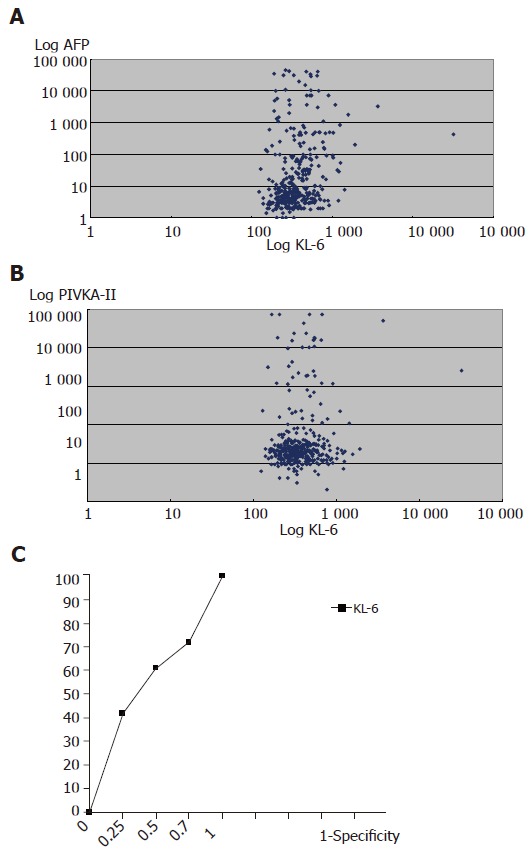
Figure 1.

A: Correlation between KL-6 U/L and AFP ng/ml serU/Levels in the study population. C = 0.04, P>0.1. The Log values of both markers are shown; B: Correlation between KL-6 U/L and PIVKA-II mAU/L serU/Levels in the study population. C = 0.03, P>0.5. The Log values of both markers are shown; C: Receiver operating characteristic curves for KL-6 as predictors of HCC. The area under the ROC was found to be 0.574 (95%CI = 0.50–0.64). The best KL-6 sensitivity was obtained at a cut-off point = 334 U/L.
