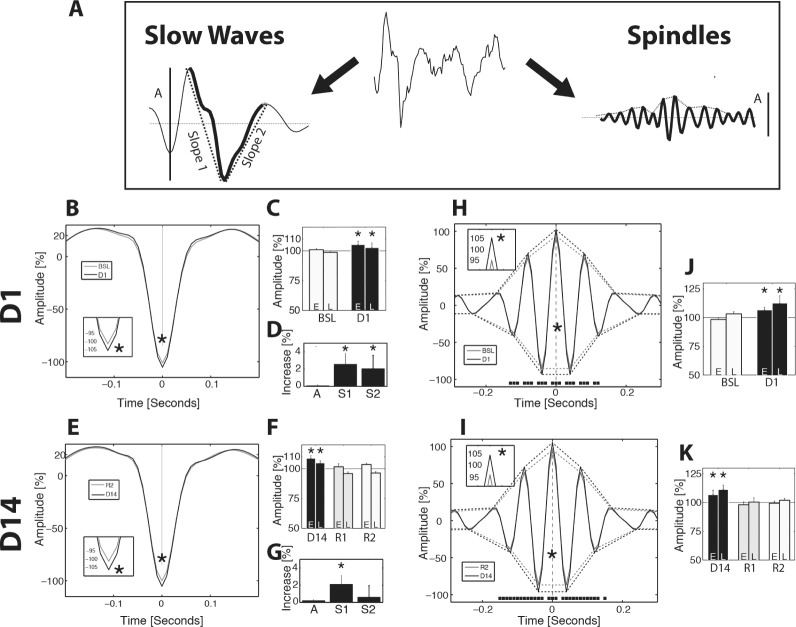
Figure 6.
Sleep waves and spindles architecture. Wave triggered average of slow waves (SW) and spindles during the light phase slow wave sleep (SWS). Representative raw electroencephalographic data with corresponding band-pass filtered traces and typical shape and amplitude (A) of SW (1–15 Hz) and spindles (10–15 Hz) is shown in panel A. (B,E) Wave-triggered average of down deflections showing a significant decrease in minima reached on D1 and D14 (P < 0.05, paired t test, inserts). (C,F) Histograms of SW amplitude in relative values for early (E, first third of light phase SWS) and late (L, third third) occurrence (P < 0.001, two-way analysis of variance [ANOVA]). (D,G) Increase in slope 1 (P < 0.005 on D1 and D14) and slope 2 (P < 0.05 on D1) for SW of equal amplitude (percentile 0.4 to 0.6). (H,I) Wave-triggered average where the maximum of spindle is centered on t = 0. Spindle envelope underlines the difference in amplitude for each peak (black squares, P < 0.05, paired t test, inserts). (J,K) Histograms showing increase in the amplitude of spindles on D1 and D14 (P < 0.001, two-way ANOVA for all) with maintenance of circadian effects when considering L versus E (P < 0.005, two-way ANOVA for all).

