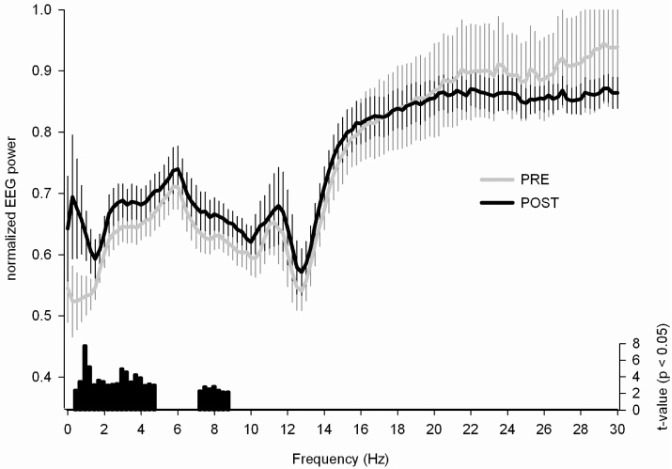
Figure 4.
Power density spectrum for cluster T. Power density spectrum (1 to 30 Hz, bin width = 0.25 Hz) for the derivation showing maximal power in cluster T (see Figure 2) during the PRE (gray) and POST (black) training night (mean ± standard error of the mean). Power density values for the derivations in cluster T were expressed relative to the mean power density across all derivations (see Methods for details about this normalization). Black vertical bars indicate significant t values of paired t tests per bin comparing normalized power density values of PRE and POST training nights.

