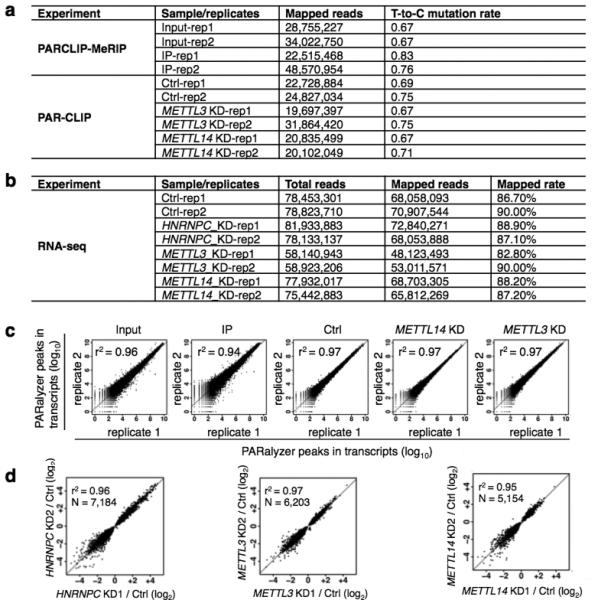
Extended Data Figure 9. Summary of the sequencing samples.

a, For PARCLIP-MeRIP and PAR-CLIP experiments from HEK293T cells, the number of mapped reads and “T-to-C” mutation rates are given for each replicate. b, For RNA-seq experiments from HEK293T cells, the number of total reads, the number of mapped reads as well as the mapping rates is given for each replicate. c, Scatter plots comparing transcripts for all PAR-CLIP replicate experiments. The square of Spearman's rank correlation value (r2) for each pair is shown in the upper left corner of the respective panel. d, The detected expression level changes show a strong correlation between gene KD replicates. Scatter plots comparing the fold changes (log2) in normalized gene expression from replicates of HNRNPC, METTL3 and METTL14 KD. The square of Spearman's rank correlation value (r2) for each pair is shown in the upper left corner of respective panels.
