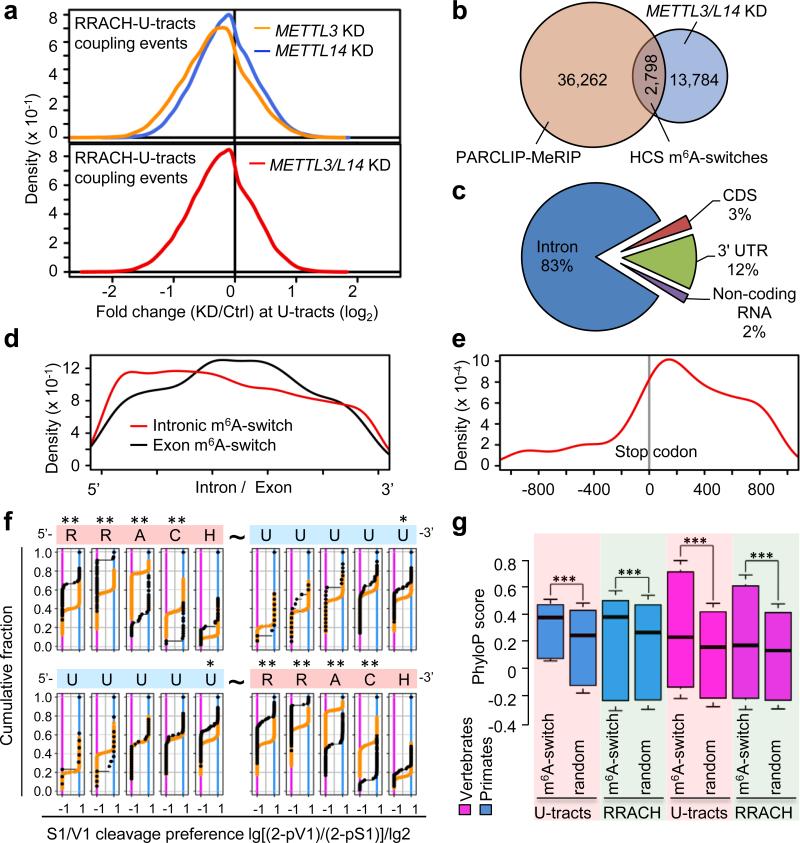
Figure 3. Global m6A reduction decreases hnRNP C binding at m6A-switches.
a, Density plot showing negative enrichment at the U-tracts. b, Identification of HCS m6A-switches. c, Region distribution of HCS m6A-switches. d, Density plot showing m6A-switches distribution relative to exon/intron boundaries. e, m6A-switches in coding RNA were enriched in the 3’UTR and near the stop codon. f, Cumulative distribution of HCS m6A-switches (black) and control (orange) regarding the S1/V1 cleavage preference (data from4) at U-tracts and RRACH motif. U-tract can be 3’ (upper) or 5’ (lower) of the RRACH motif. *: p < 0.05, **: p < 10−4, Kolmogorov-Smirnov test. g, Phylogenetic conservation of HCS m6A-switches among primates and vertebrates. ***: p < 10−16, Mann-Whitney-Wilcoxon test.

