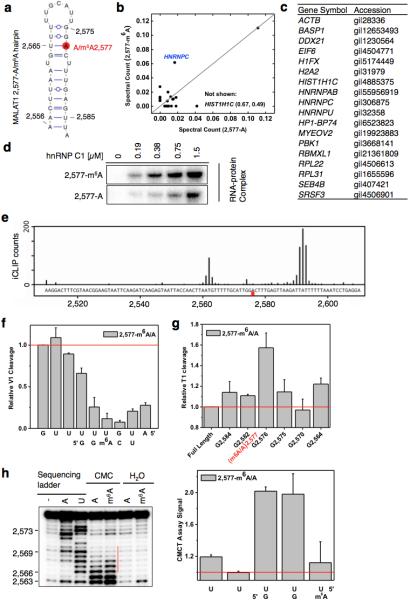
Extended Data Figure 1. m6A increases the accessibility of U-tract to enhance hnRNP C binding.

a, Secondary structure of the MALAT1 hairpin with m6A methylation at 2,577 site shown in red25. Nucleotide position numbers correspond to their locations along the human MALAT1 transcript (NR_002819). b, RNA pull down showing hnRNP C preferably binds methylated RNA. c, The list of proteins with identified peptides by mass spectrometry in b. d, Recombinant hnRNP C1 binds stronger with MALAT1 2,577-m6A hairpin compared to the unmethylated hairpin, as determined by in vitro UV crosslinking assay23. e, hnRNP C shows binding around A2,577 site along MALAT1 in vivo, as determined by previously published hnRNP C iCLIP data20. The underlying genomic sequence is shown at the bottom with a red square marking the m6A2,577 site. The slight shift of the iCLIP signal to upstream of the U-tract binding site is likely due to the steric hindrance of the peptide fragment remaining on RNA which can cause reverse transcription to terminate more than one nucleotide upstream of the cross-link site20. f, Quantification of the RNase V1 cleavage signal for the U-tract region from RNA structural mapping assay in Fig. 1e. To correct for sample loading difference, each band signal was normalized to the band signal of the immediate 3’ residue to the U-tract. n = 3, ± s.d., technical replicates. g, Quantitative of the RNase T1 cleavage signal from RNA structural mapping assay in Fig. 1e. Increased RNase T1 cleavage signal (single-stranded specific & cleavage after guanosines) was observed due to the surrounding m6A residue. To correct for sample loading difference, the ratio for each band signal among all bands in each lane was calculated. The y-axis value Relative T1 cleavage = (m6Anative/m6Adenature)/(Anative/Adenature). n = 2, technical replicates. h, Quantitative CMCT mapping showing increased signals for the U-tract bases around the U base-pairing with m6A. Quantitation of band signals within the U-tract region is shown on the right. n = 4, ± s.d., technical replicates.
