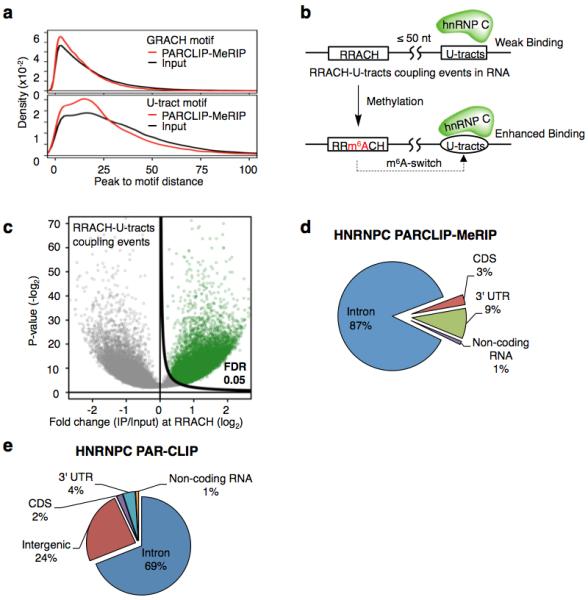
Extended Data Figure 4. PARCLIP-MeRIP identifies transcriptome-wide m6A-switches in the vicinity of hnRNP C binding sites.

a, Density plots illustrating the distribution of distance between the PARCLIP-MeRIP/Input peaks and the nearest GRACH motif (top) or the nearest U-tracts in (bottom). b, Definition and identification of hnRNP C m6A-switches based on the PARCLIP-MeRIP analysis. Approximately 89% of PARCLIP-MeRIP peaks harboring both the U-tract and RRACH motif have “RRACH-U-tract” inter-motif distance within 50 nucleotides, significantly higher than the 64% of such coupling within the genomes. hnRNP C m6A-switches are identified as m6A methylated RRACH-U-tracts coupling events. c, Volcano plot depicting all coupling events (unfilled circles) as defined in b, according to their p-values37 (P, y-axis) and fold change values at RRACH sites (E, x-axis). To identify hnRNP C m6A-switches, we generated the π-value, π=E·(-log10P), as one comprehensive parameter to pick meaningful genomic loci38. hnRNP C m6A-switches identified from PARCLIP-MeRIP experiments should fulfill the following requirements: (i) read counts at both the control and IP sample ≥ 5; (ii) π-value ≥ 0.627, corresponding to False Discovery Rate (FDR) ≤ 5%. d, Pie chart depicting the region distribution of hnRNP C m6A-switches identified by PARCLIP-MeRIP. e, Pie chart depicting hnRNP C PAR-CLIP peaks. These are enriched in introns, consistent with previous reports that hnRNP C binds mainly nascent transcripts19,23,25.
