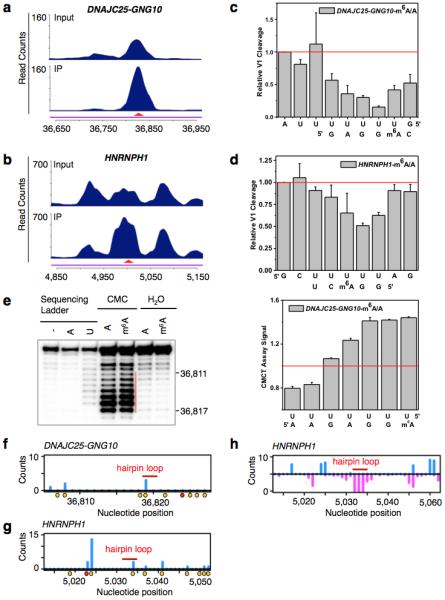
Extended Data Figure 5. Validation of two identified m6A-switches.

a-b, PARCLIP-MeRIP data detected positive IP/Input enrichment at the RRACH sites (red arrowheads) on the DNAJC25-GNG10 gene (a) and HNRNPH1 gene (b) in HEK293T cells. c-d, Quantification of RNase V1 cleavage signals around the U-tract region of m6A-switches on the DNAJC25-GNG10 (c) and HNRNPH1 (d) transcript, related to Fig. 2g-h. n = 3, ± s.d., technical replicates each. e, Quantitative CMCT mapping of DNAJC25-GNG10 m6A-switch shows increased band signals around the uridine base that pairs with m6A. The red vertical line marks the U-tract region. Quantitation of bands signal for the U-tract region is shown on the right. n = 3, ± s.d., technical replicates. HNRNPH1 m6A-switch hairpin is not suitable for CMCT probing, because its reverse transcription binding primer region is too short. f-g, In vivo DMS mapping of the DNAJC25-GNG10 hairpin (f) and HNRNPH1 (g); data are from7. A and C residues are marked with orange dots and the m6A residue is marked with a red dot. The hairpin loops are indicated by red bars. h, Transcriptome-wide S1/V1 mapping around the HNRNPH1 m6A-switch site. Blue bars represent V1 signal; magenta bars represent S1 signal. The hairpin loop is indicated by a red bar; data are from4. Not enough reads could be collected to make a plot for the DNAJC25-GNG10 m6A-switch region.
