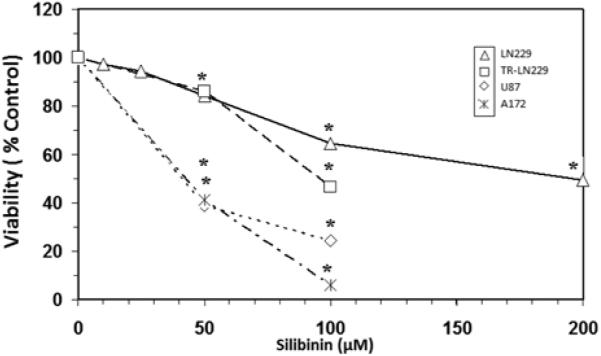
Figure 1.

Toxicity of silibinin on A172, U87, LN229 and temozolomide-resistant LN229 (TR-LN229) cell lines. The data is presented as viability % control, and represents the Mean±S.E.M, n=3. Significant differences from the controls were evaluated by a one-way ANOVA, followed by Bonferroni's multiple comparison test, *=p<.05. The IC50s were established by regression analysis corresponding to: A172=40 μM, U87=45 μM, LN229=200 μM and TR-LN229=95 μM.
