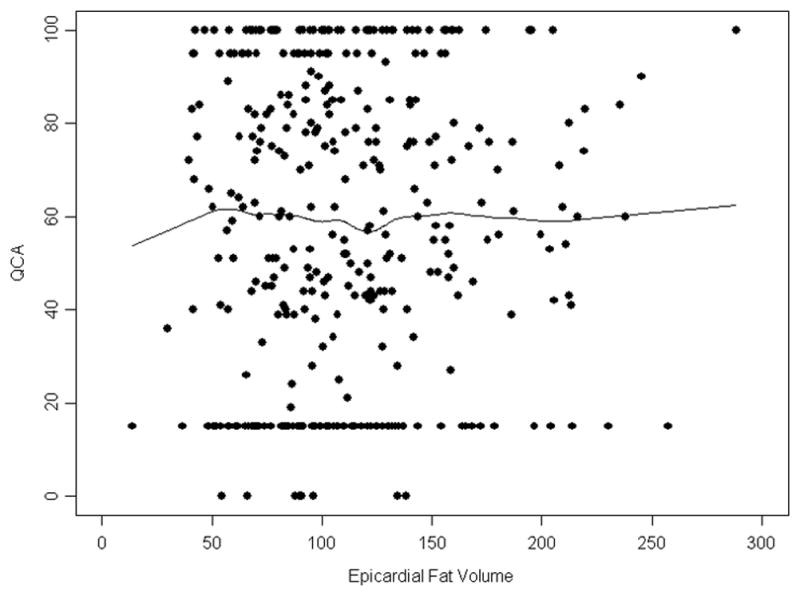
Figure 4. Relationship between Epicardial Fat Volume and Coronary Artery Stenoses.

Shown is a scatterplot and Lowess smoothing of epicardial fat volume (EFV) and presence of a ≥50% stenosis by quantitative coronary angiography (QCA) stenosis revealing no significant association. Please note clustering of data points at the extreme ranges due to imputation of values less than 30% and at 100%.
