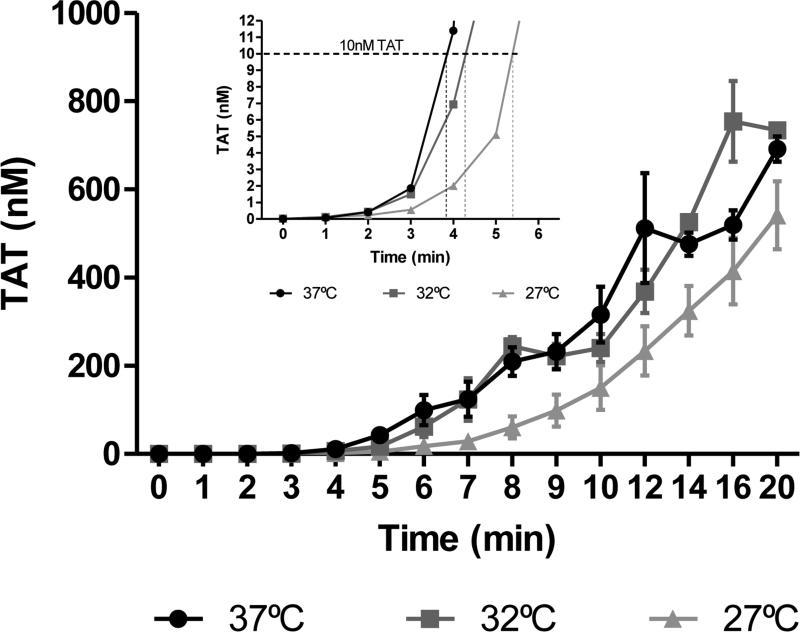
Figure 1. Thrombin generation in whole blood.
Whole blood was drawn into 0.1 mg/mL CTI and activated by 5 pM Tf at t=0. Samples were quenched at varying intervals with EDTA and FPR-chloromethyl ketone prior to being analyzed by TAT ELISA. Main figure. αTAT generation profiles for healthy individuals at 37(●), 32(■) and 27°C (▲) (N=3). Inset. αTAT generation profiles at 37°C (●), 32°C (■) and 27°C (▲) (N=3) for the first 6 minutes of the time course. Data are shown as the mean±SEM.

